Impact of a road corridor
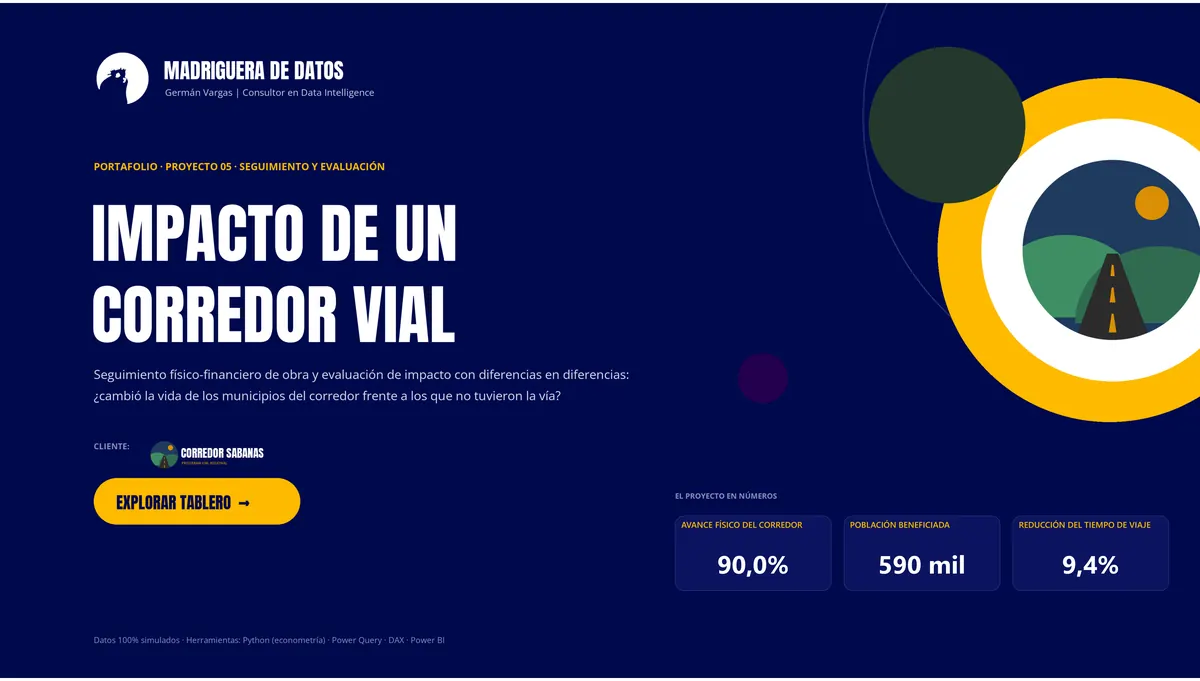
Physical-financial works tracking and a difference-in-differences impact evaluation: did life change in the corridor municipalities compared with those without the road?
The challenge
The program had to report on two fronts: whether works progressed as contracted, and whether the road delivered the promised results in travel time, costs, income, and access to services. Measuring that means separating the corridor’s effect from what would have happened without it.
Python (econometría) · Power Query · DAX · Power BI
Key findings
- Physical progress of 90% vs. 99.5% scheduled; the Ovejas – El Carmen de Bolívar section lags most (SPI 0.70).
- 4 of 8 indicators show significant effects; travel time drops 9.4% due to the corridor.
- Delivered sections show more crashes: road safety needs investment before closing.
Capabilities shown
- Difference-in-differences with fixed effects
- Clustered errors and event study
- S-curve, SPI, and contract milestones
- Unintended effects: crashes before and after
Dashboard tour
7 views. Click any view to enlarge it.
Live interactive dashboard
Use the filters and the navigation menu inside the dashboard, just as a manager would.
More prototypes from this service
 Power BI dashboard
Student retention
Dropout, cohorts, early warning with a predictive model, and tracking of the interventions that help more students finish their degree.
View prototype AI agent
Survey & voice-of-customer analyzer
Reads hundreds of open-ended answers, builds the codebook, classifies topic and sentiment, cross-tabs by campus, pulls quotes, and delivers the report.
View prototype AI agent
Project evaluation assistant
Reads a project proposal, builds and validates the logical framework, recommends the impact evaluation design, and checks that the sample is feasible.
View prototypeReady to turn your data into smart decisions?
We build this kind of solution with your own data. Let’s start with a free 30-minute call.