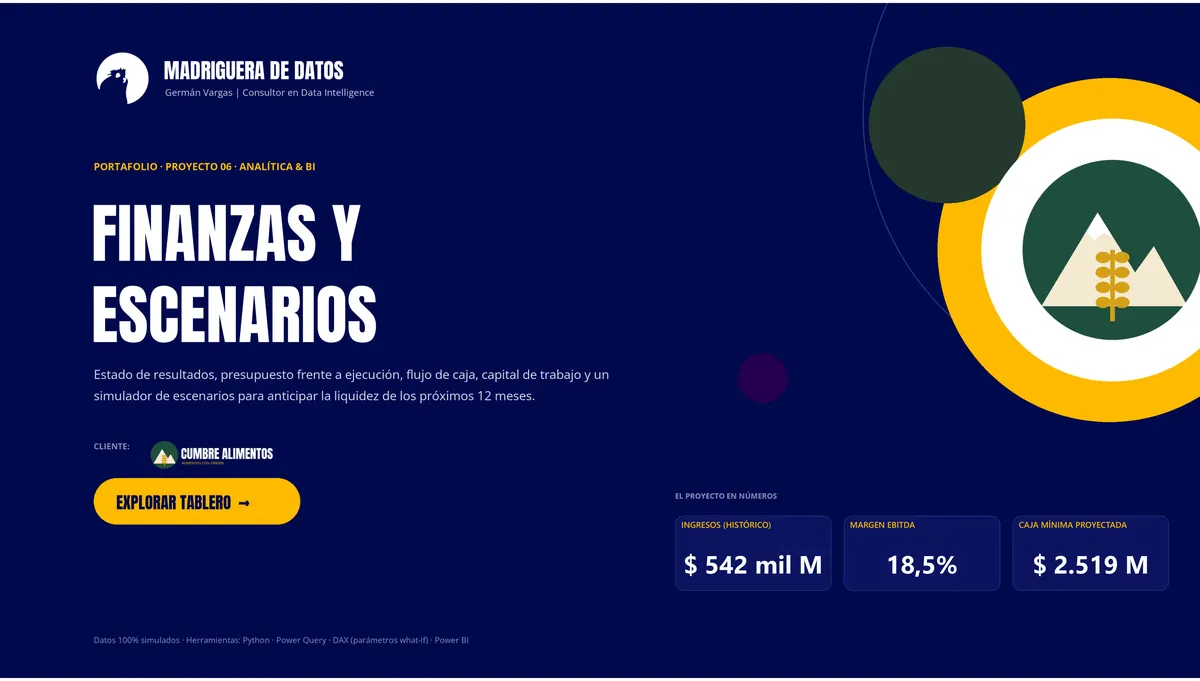
Finance & scenarios
Income statement, budget vs. actuals, cash flow, working capital, and a scenario simulator to anticipate liquidity over the next 12 months.
The challenge
Cumbre Alimentos’ finance team closed each month in Excel and answered two questions too late: why does margin miss budget, and is there enough cash if raw materials rise or customers pay later?
Python · Power Query · DAX (parámetros what-if) · Power BI
Key findings
- Revenue of COP 155,917 M (96.9% of budget) with a 19.9% EBITDA margin.
- Administration is the most over-spent cost center (108.6% of budget).
- The cash conversion cycle went from 53 to 57 days; every 5 extra days of receivables tie up about COP 3,145 M.
Capabilities shown
- What-if simulator: price, volume, raw materials, receivables
- 12-month cash projection
- Budget to date, excluding future months
- Waterfalls from revenue to profit
Dashboard tour
7 views. Click any view to enlarge it.
Live interactive dashboard
Use the filters and the navigation menu inside the dashboard, just as a manager would.
More prototypes from this service
 Power BI dashboard
360° digital brand intelligence
Social media, social listening with emotion analysis, web traffic, and campaign ROI in one dashboard to decide what to publish, where to invest, and when to react.
View prototype Power BI dashboard
Sales intelligence
Sales, margin, targets, customers, and regions for a specialty coffee brand selling through four channels: B2B distribution, own stores, e-commerce, and marketplaces.
View prototype Power BI dashboard
Management performance tracking
Balanced scorecard, project portfolio with earned value, action plan, and risk matrix for the management committee of a logistics company.
View prototype Power BI dashboard
Logistics control tower
On-time-in-full deliveries, distribution network map, fleet, distribution centers, and delivery exceptions for a nationwide parcel and freight company.
View prototype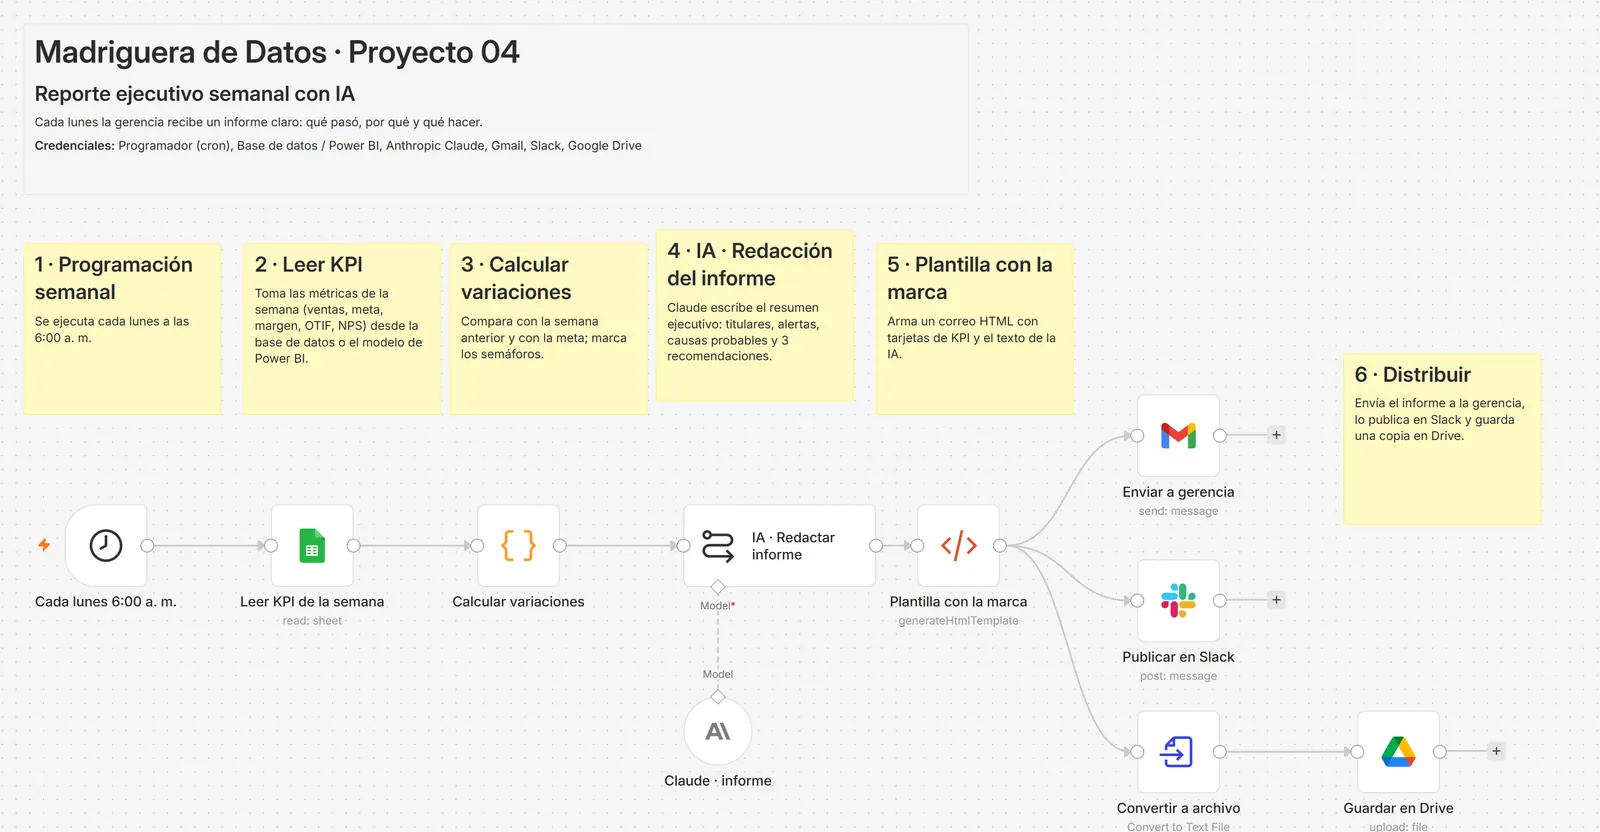 n8n + AI automation
Weekly AI executive report
Every Monday, management gets a clear report: what happened, why, and what to do.
View prototype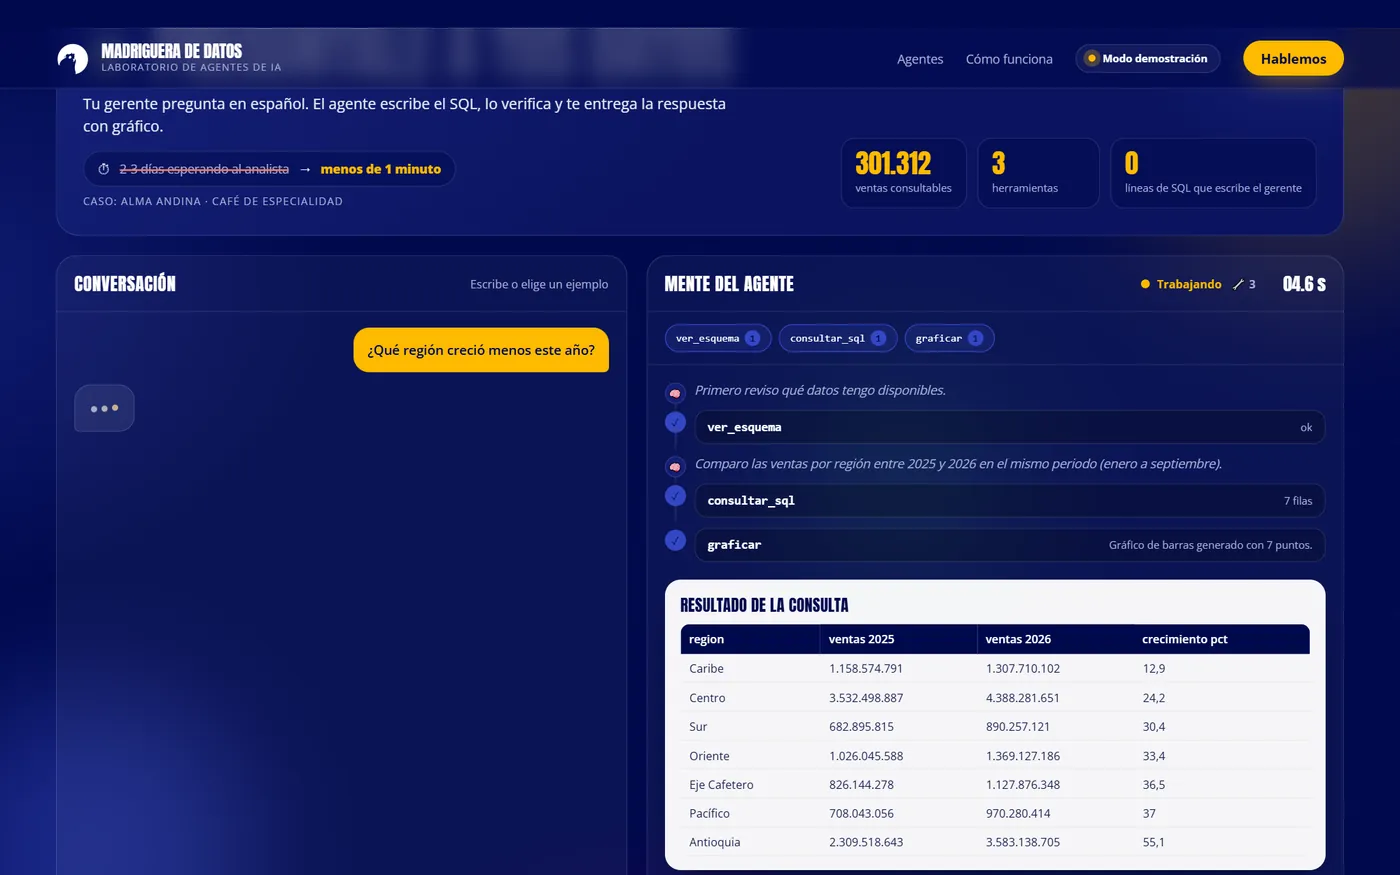 AI agent
Ask your data
Managers ask in plain language; the agent explores the database, writes and fixes SQL, charts the result, and answers with findings and a recommendation.
View prototypeReady to turn your data into smart decisions?
We build this kind of solution with your own data. Let’s start with a free 30-minute call.